Corrosion Rates of Alpha Descaler
Products vs Two Common
Competitive Mineral Acid Products
Marketed as Safe Descalers
John MacDonald III
Date: 8/6/2019
Tests Performed by Green Products and
Technologies, LLC.
For
Tech Sales Co.
Introduction:
Corrosion testing was conducted on three alloys commonly used in heat exchangers. Those alloys were
CDA706 (copper-nickel 90/10), CDA922 (bronze Navy M), and CDA715 (copper-nickel 70/30). Testing was
conducted in accordance with the ASTM G31 standard. Below you will see the specific observations about the types and severity of corrosion as it varies from product to product. The products tested were Alpha Descaler FG Extra Strength, Alpha Descaler FG, Alpha Descaler Extra Strength, Alpha Descaler, competitive product R, and competitive product D.
Procedure:
Test was conducted in accordance with ASTM G31 and associated standards in open top glass vessels under ambient conditions for 72 hours. Coupons were prepared by abrasion with #00 steel wool and cleaning with hexane. They were dried and then weighed using a Radwag analytical balance. Coupons were completely submerged in test solutions for 72 hours. Once the test was completed coupons were cleaned by submersion in an ultrasonic cleaner followed by cleaning with hexane. They were then dried, weighed, and the results were calculated.
Results:
The calculated corrosion rates in MILS per year are provided in Table 1 below.
Material |
Product |
MPY |
|---|---|---|
| CDA706 | Alpha Descaler FG | 8.36 |
| CDA922 | Alpha Descaler FG | 6.07 |
| CDA715 | Alpha Descaler FG | 3.8 |
| CDA706 | Alpha Descaler FG Extra Strength | 13.94 |
| CDA922 | Alpha Descaler FG Extra Strength | 10.66 |
| CDA715 | Alpha Descaler FG Extra Strength | 6.56 |
| CDA706 | Alpha Descaler | 7.02 |
| CDA922 | Alpha Descaler | 5.15 |
| CDA715 | Alpha Descaler | 3.15 |
| CDA706 | Alpha Descaler Extra Strength | 7.77 |
| CDA922 | Alpha Descaler Extra Strength | 5.7 |
| CDA715 | Alpha Descaler Extra Strength | 3.5 |
| CDA706 | Product D | 22.28 |
| CDA922 | Product D | 22.48 |
| CDA715 | Product D | 6.65 |
| CDA706 | Product R | 15.09 |
| CDA922 | Product R | 13.58 |
| CDA715 | Product R | 6.76 |
Table 1- Corrosion Rates
CDA706 – Copper Nickel 90/10, CDA922 – Bronze, Navy M, CDA715 – Copper Nickel 70/30
As can be seen in Table 1 all products tested performed well on CDA715 while Alpha Descaler products
performed significantly better than either competitor on both CDA706 and CDA922. Further, the test coupons submerged in Alpha Descaler showed little discoloration and no obvious localized corrosion. Further examination under a microscope showed uniform corrosion with no evidence of pitting and only mild edge attack. Product R also showed uniform corrosion while slightly worse along the edges. However, Products R also left all three coupons darkened and discolored. Finally, Product D performed significantly worse on both CDA706 and CDA922 and was the only product tested with corrosion rates over 20 MILS per year. Examination of the specimens under microscope revealed severe edge attack. It should also be noted that data provided to Green Products and Technologies for Product D shows similar corrosion rates on CDA715 to my own results, and data for their “Competitor” was also similar to my own data for Product R. However, Product D corrosion rates for CDA706 and CDA922 were 4-5 times higher in my testing vs the results provided and circulated by the manufacturer.
Corrosion Rates
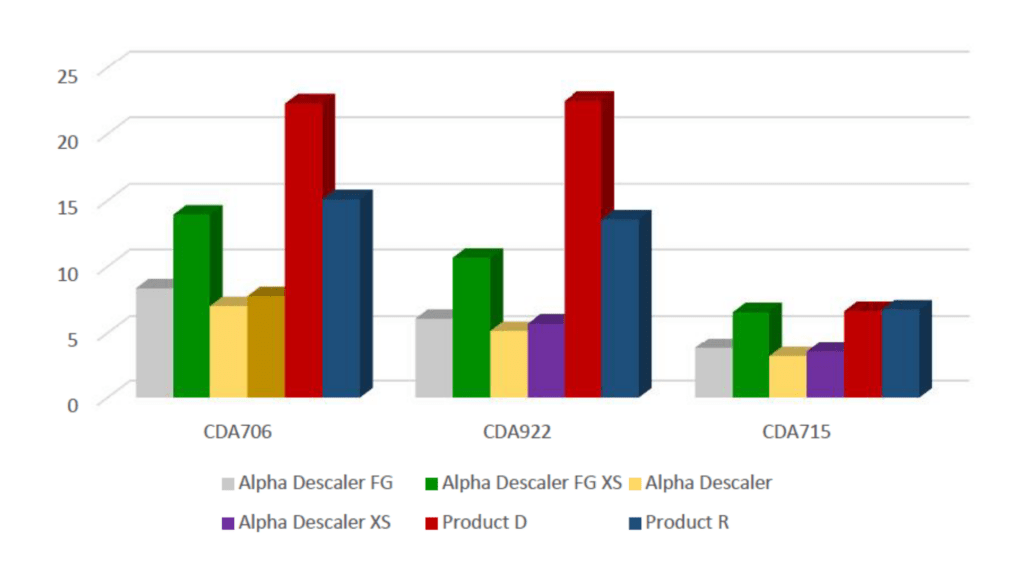
Chart 1 – Corrosion Rates (Data from Table 1)
Despite the superior and lower metal corrosion rates of Alpha Descaler and Alpha Descaler FG, both products were similar in their scale removal capacity to the more corrosive.competitive products claiming approximately 10% HCL. The Extra Strength versions, while being approximately 60% greater in scale dissolving capacity were still lower in metal corrosion when compared to the HCL based products.